#reklam (Ad) Takes the Lead as Platforms Diverge
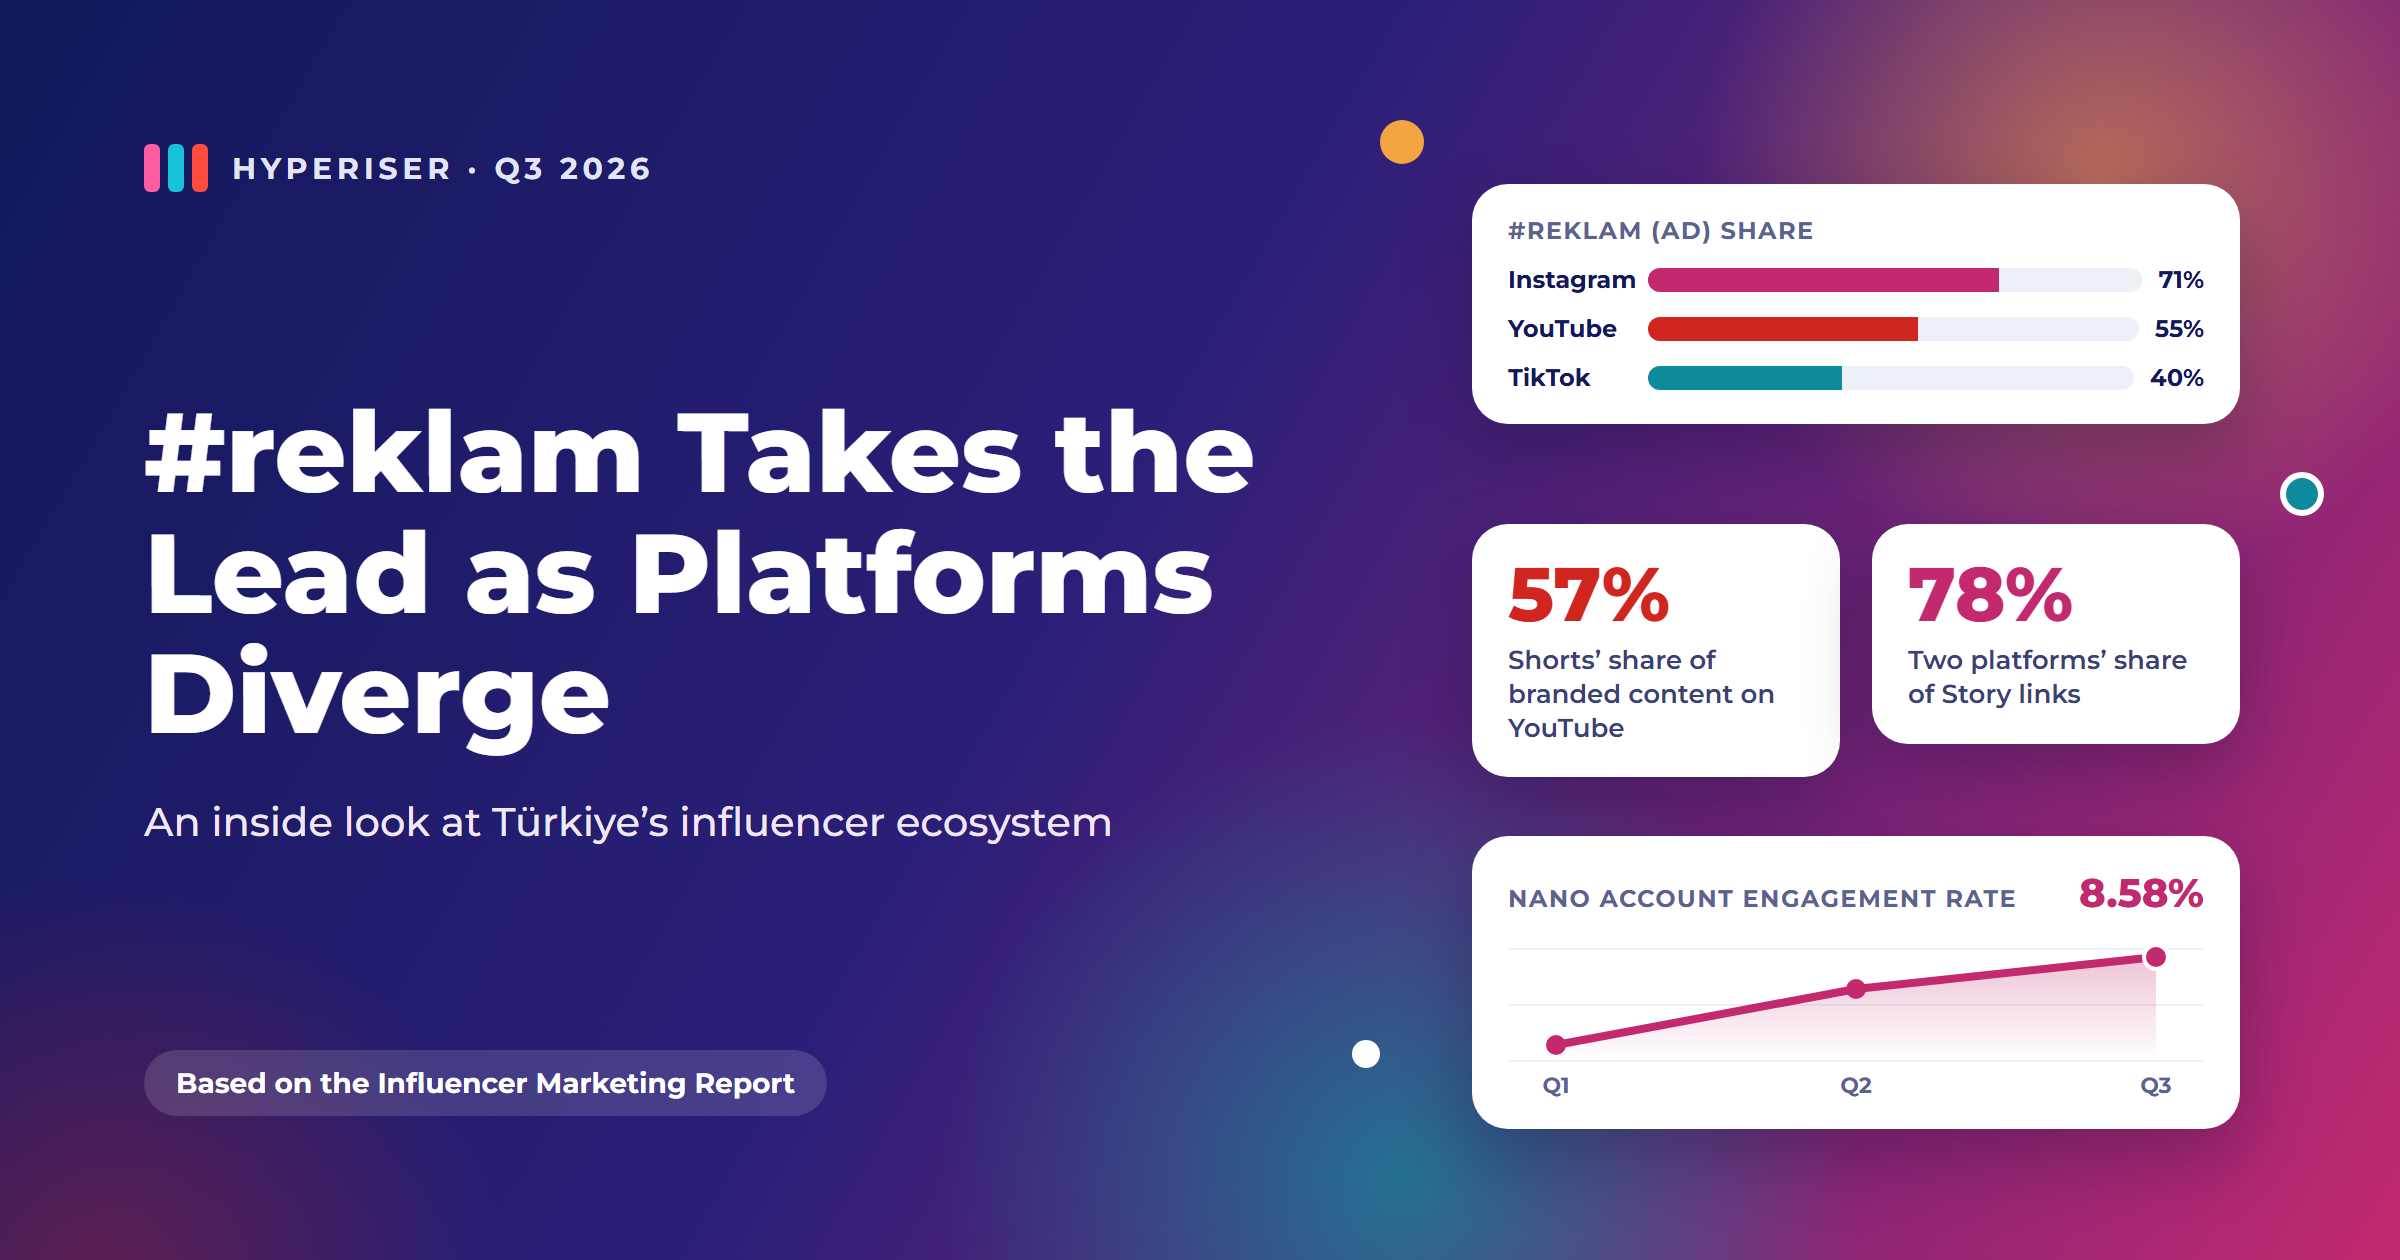
Brand-tagged influencer content in Türkiye kept growing in the third quarter of 2026. According to the Hyperiser Q3 2026 Influencer Marketing Report, the 49,085 influencers tracked shared more than 8.6 million posts between July and September. Of these, 346,641 were brand-tagged, up 22% from the previous quarter.
Two developments stood out in Q3. First, within a single quarter, the advertising regulation that took effect on August 1 changed how collaborations are disclosed. Second, Instagram, TikTok and YouTube are increasingly diverging: e-commerce gained weight on Instagram, while short-form video accounted for the majority of brand-tagged content on YouTube for the first time.
In this article, we examine the report’s data through six questions.
1. How has the new regulation affected the dynamics of influencer marketing in Türkiye?
The Regulation Amending the Regulation on Commercial Advertising and Unfair Commercial Practices, published in Official Gazette No. 33297 on July 1, 2026, took effect on August 1, 2026. It requires collaborative posts to be clearly disclosed with the words “reklam” (advertisement) or “tanıtım” (promotion).
The first effect showed up in disclosure hashtags. On Instagram, #reklam reached a 71% share of collaboration hashtags; together with #tanıtım, the figure rose to 75%.
The speed of this shift is also visible among the highest-engagement collaborations. On Instagram, the share of these posts using #reklam rose from 47% before August 1 to 79% afterwards. Within two months, use of #reklam increased markedly even in the content that draws the most engagement.
Over the same period, the hashtag #reklamdeğil (“not an ad”) also stood out, entering the 20 most-used hashtags on both Instagram and TikTok. Its rise suggests that influencers also feel the need to clarify posts that do not involve a collaboration.
TikTok tells a different story. Here, #reklam and #tanıtım accounted for only 49% of collaboration hashtags; on YouTube, the figure was 63%. #işbirliği (“collaboration”), which led on TikTok with a 79% share in the second quarter, fell to 46% but remained the platform’s most-used disclosure hashtag.
One more figure shows the transition is not yet complete: 45% of brand-tagged content on Instagram carried at least one collaboration hashtag. Q3 can be read as a transition period in which the standard is beginning to take shape.
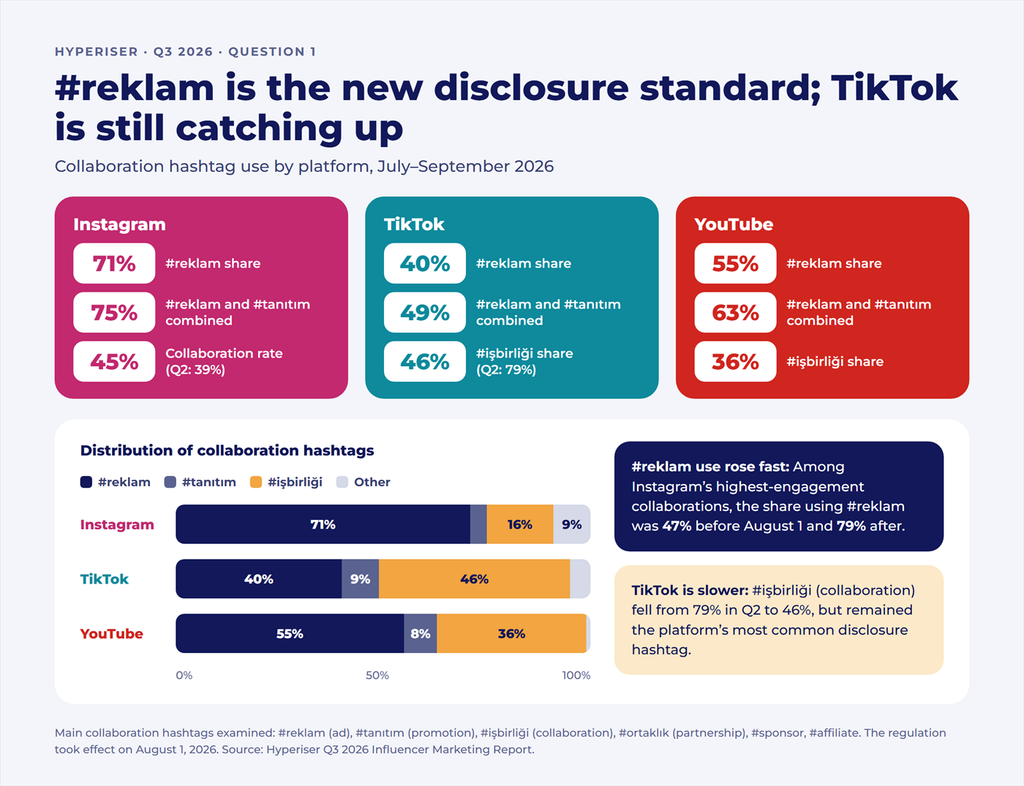
Distribution of collaboration hashtags by platform, Q3 2026. Source: Hyperiser Q3 2026 Influencer Marketing Report
2. Are platforms developing different influencer marketing models?
Each platform has a different leading sector. On Instagram, .com (e-commerce) brands appeared in 46% of brand-tagged content, up from 36% in the second quarter. FMCG came second with 17%.
On TikTok, the distribution is more balanced than on Instagram. FMCG leads with 34%, followed by Textile/Footwear and Retail at 11% each and .com at 10%. The share of brands outside the top five sectors also rose by five points.
On YouTube, the sector mix broadened. Press/Publishing, which led in the second quarter with 28%, fell to 10%, while Automotive moved into first place with 22%. The share of brands outside the top five sectors rose from 27% to 39%.
Timing also varies by platform. On Instagram, brand-tagged content peaked in the last month of the quarter in each of the year’s first three quarters; in Q3, 38% of posts were shared in September. On TikTok, activity peaked in July (39%), and September was the quietest month of the quarter (29%).
This divergence suggests that reach cannot be the only criterion in choosing a platform. Instagram appears better suited to e-commerce communication and link referrals. On TikTok, fast-moving consumer goods stand out, while on YouTube, products that call for detailed explanation come to the fore.
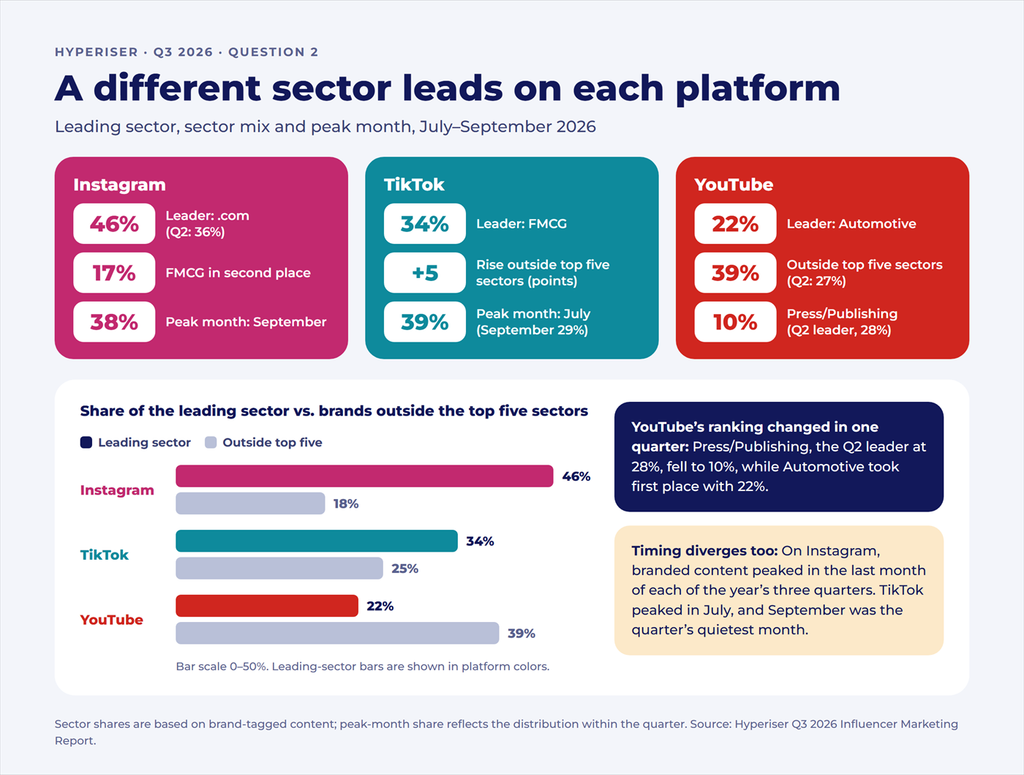
Leading sector, sector mix and peak month by platform, Q3 2026. Source: Hyperiser Q3 2026 Influencer Marketing Report
3. Where do Story links lead?
On Instagram, 85% of brand-tagged content was shared as Stories. The share of brand-tagged Stories containing a link rose from 52% in the second quarter to 62% in the third. More than one million links were shared across all Stories during Q3.
Of these links, 55% went to Trendyol and 23% to Hepsiburada. The two platforms’ combined share was 71% in the first quarter of the year and reached 78% in Q3. The rest of the list is highly fragmented. Ticketing platforms such as Bubilet and Biletinial, as well as infrastructure services such as Shopier, made the top 10, but these eight brands together accounted for only about 5%.
This rise in linked Stories shows that link sharing has become more common in influencer content on Instagram. Users can go from the Story where they see the content to a product page with a single tap, and 78% of shared links point to just two platforms.
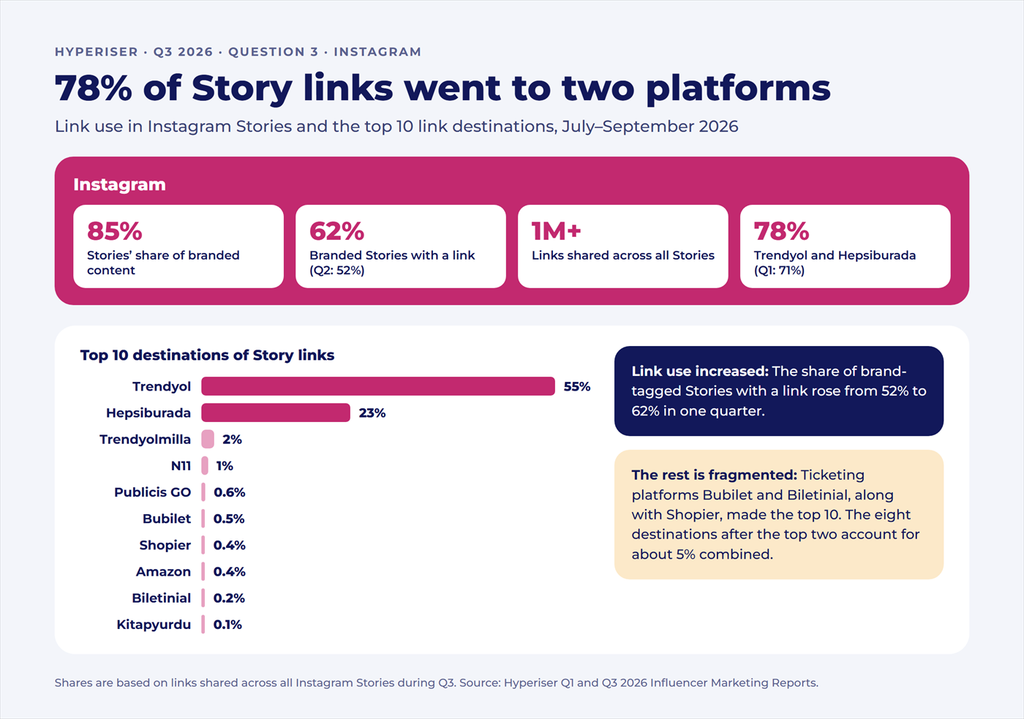
Link use in Instagram Stories and the top 10 link destinations, Q3 2026. Source: Hyperiser Q1 and Q3 2026 Influencer Marketing Reports
4. Are short and long videos taking on different roles?
On YouTube, Shorts reached 57% of brand-tagged content in Q3, overtaking long-form video for the first time. Engagement reverses the ranking: long-form videos had an average engagement rate of 2.80%, compared with 1.54% for Shorts. Among the highest-engagement collaborations, the share of comments in total engagement was about 3.5 times higher for long-form videos than for Shorts.
Shorts lend themselves to fast production and first contact. Among the 100 highest-engagement YouTube collaborations, seven Shorts themed around travel and back-to-school/back-to-the-city surpassed 20 million views. Long-form video, meanwhile, leaves room to explain a product in detail and answer viewers’ questions; the difference in comments reflects this.
Automotive’s rise to the top on YouTube, with a 22% share, is consistent with this pattern. For products that call for detailed review, such as cars or technology, a short video can spark interest, while users at the decision stage may look for a longer explanation.
Rather than choosing between the two formats, it may therefore be more effective to give each a separate role: Shorts for reach and discovery, long-form video for evaluation and persuasion.
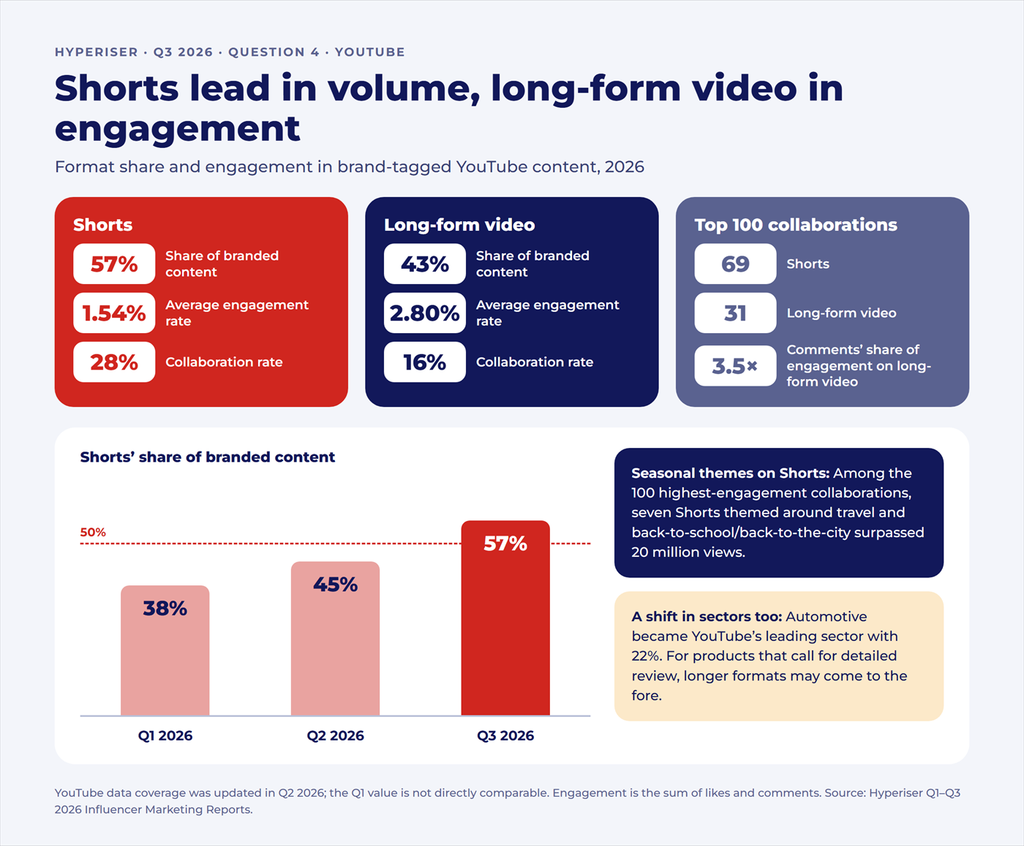
Format share and engagement in brand-tagged YouTube content, Q1–Q3 2026. Source: Hyperiser Q1–Q3 2026 Influencer Marketing Reports
5. Is an influencer’s value shifting from follower count to their role in the campaign?
On Instagram, the average engagement rate of Nano accounts rose every quarter of the year: 6.57% in Q1, 7.85% in Q2 and 8.58% in Q3. In Q3, the rate was 4.72% for Micro, 3.54% for Mid, 2.91% for Macro and 2.57% for Mega accounts.
Looking at total engagement reverses the ranking. Among the 100 highest-engagement Instagram collaborations, 80% of total engagement came from Mega accounts. Nano accounts draw a much more intense response relative to their follower counts, while Mega accounts generate far greater volume at a lower rate.
TikTok’s average engagement rate of 3.20% was the highest of the three platforms. Among the 100 highest-engagement collaborations, Macro accounts averaged 47K engagements per post, ahead of Mega accounts (44K). Of the 100 posts on the same list, 58 belonged to eight brands that ran their campaigns with at least three influencers.
Ranking segments on a single measure of success can therefore be misleading. Engagement rate measures the intensity of a community’s response, while total engagement measures a campaign’s volume; reading them correctly means looking at both together. In choosing influencers, the role to be played in the campaign is becoming as decisive as account size: is the goal intense engagement within a specific community, broad scale in a short time, or something in between?
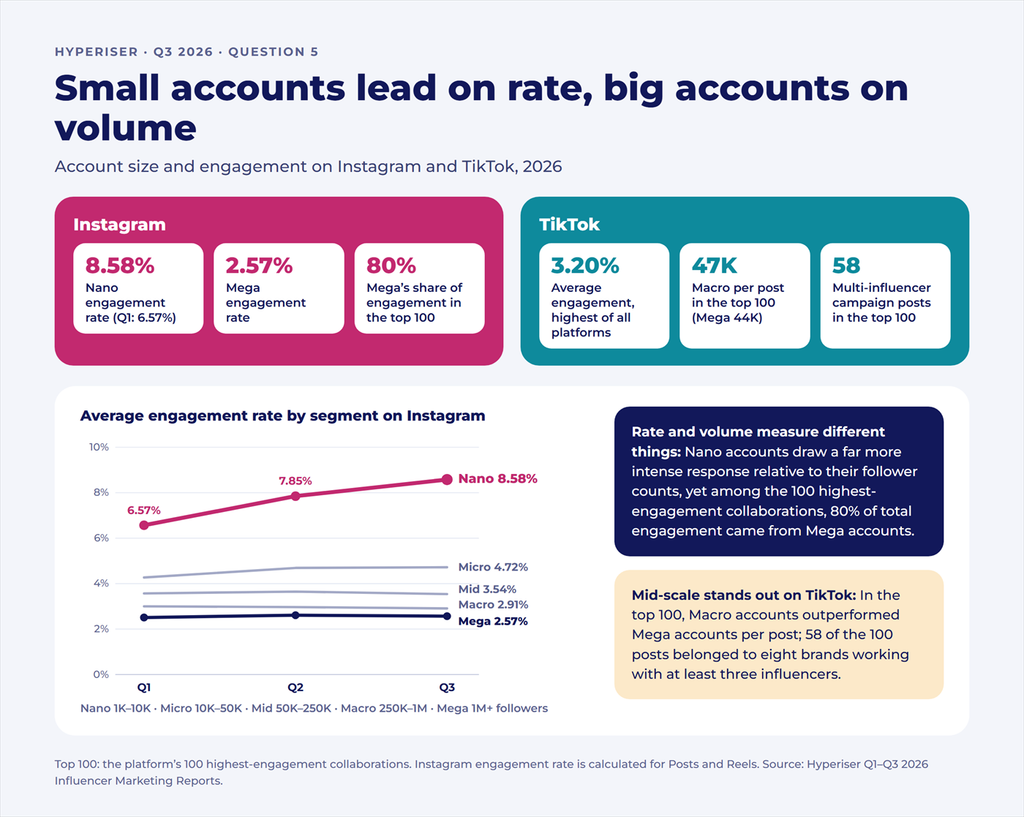
Account size and engagement on Instagram and TikTok, 2026. Source: Hyperiser Q1–Q3 2026 Influencer Marketing Reports
6. When does repeated content turn into a brand–influencer relationship?
On Instagram, influencers working with e-commerce brands posted more often in Q3. In the .com sector, the average number of brand-tagged posts per influencer rose from 24 in Q2 to 35 in Q3.
More frequent content does not in itself mean a stronger relationship. Stories posted back to back within a single campaign and a partnership lasting months can both push this number up. The figure does not distinguish between the two.
For repetition to become a relationship, the content needs to build on itself over time. As influencers get to know a product, they can develop different contexts of use, and audiences begin to see continuity between the brand and the influencer. Repeating the same message more often, by contrast, remains an intensified version of the short-term model.
Where is influencer marketing in Türkiye heading?
Q3 data clearly reveal two shifts. Within two months of the regulation taking effect, use of #reklam rose markedly on Instagram, while the change on TikTok was more limited. Platforms are also diverging in terms of sector, format and account size.
Given these differences, each platform increasingly benefits from a plan of its own. Which metric to watch on which platform is becoming as important as the campaign itself.
For detailed analyses by sector, brand and influencer, see the Hyperiser Q3 2026 Influencer Marketing Report.